
The Dashboard is the first page you see after logging in. It shows how many people visit your booking pages, how many of them book, and which team members and events bring in the most bookings.
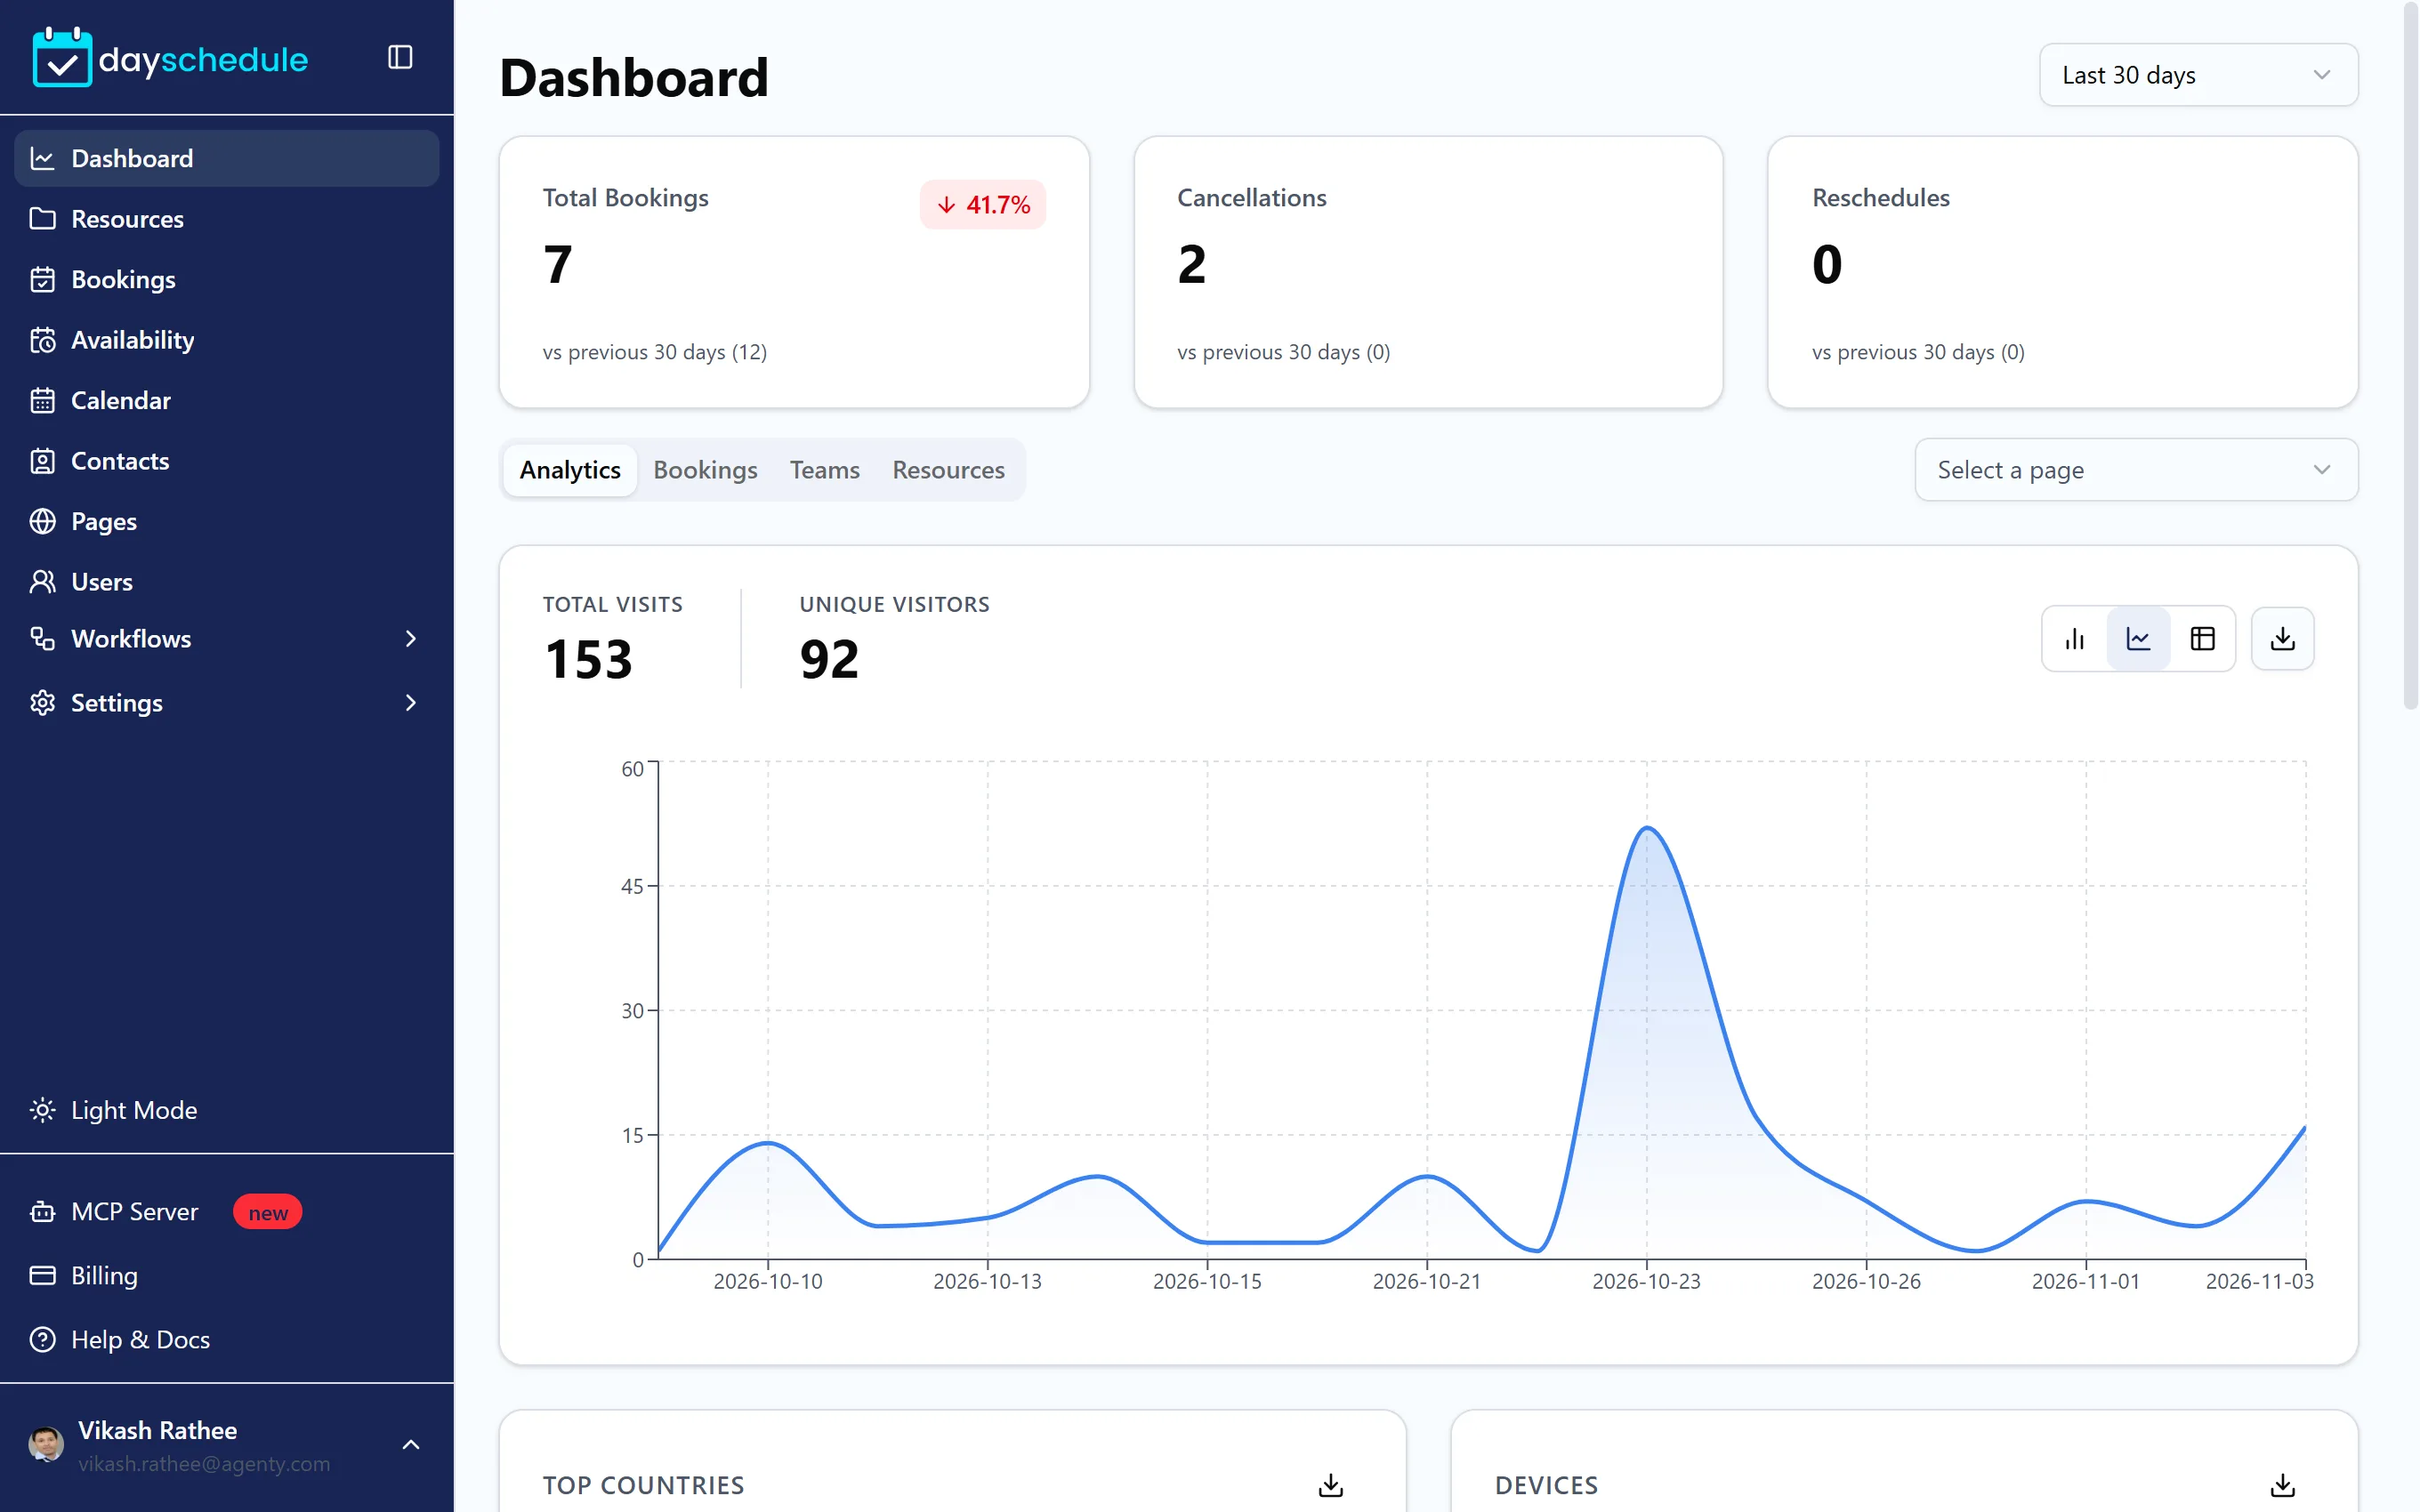
Pick a period
The menu in the top right sets the period for everything on the page: Last 7 days, Last 30 days, Last 90 days or Last year. The three cards at the top show Total Bookings, Cancellations and Reschedules for that period, compared with the period before, such as "vs previous 30 days".
Booking page traffic
The Analytics tab shows visits to your booking pages:
- Total Visits and Unique Visitors over time. Switch between a bar chart, line chart and table, or download the data.
- Top Countries, Devices and Traffic Sources, so you know where visitors come from, such as Google, LinkedIn or your website.
Use Select a page to see one booking page instead of all of them. Analytics data isn't real-time and updates every hour. For deeper analysis, add your Google Analytics ID or Meta Pixel to the page. See Customize your booking page.
Bookings, customers and revenue
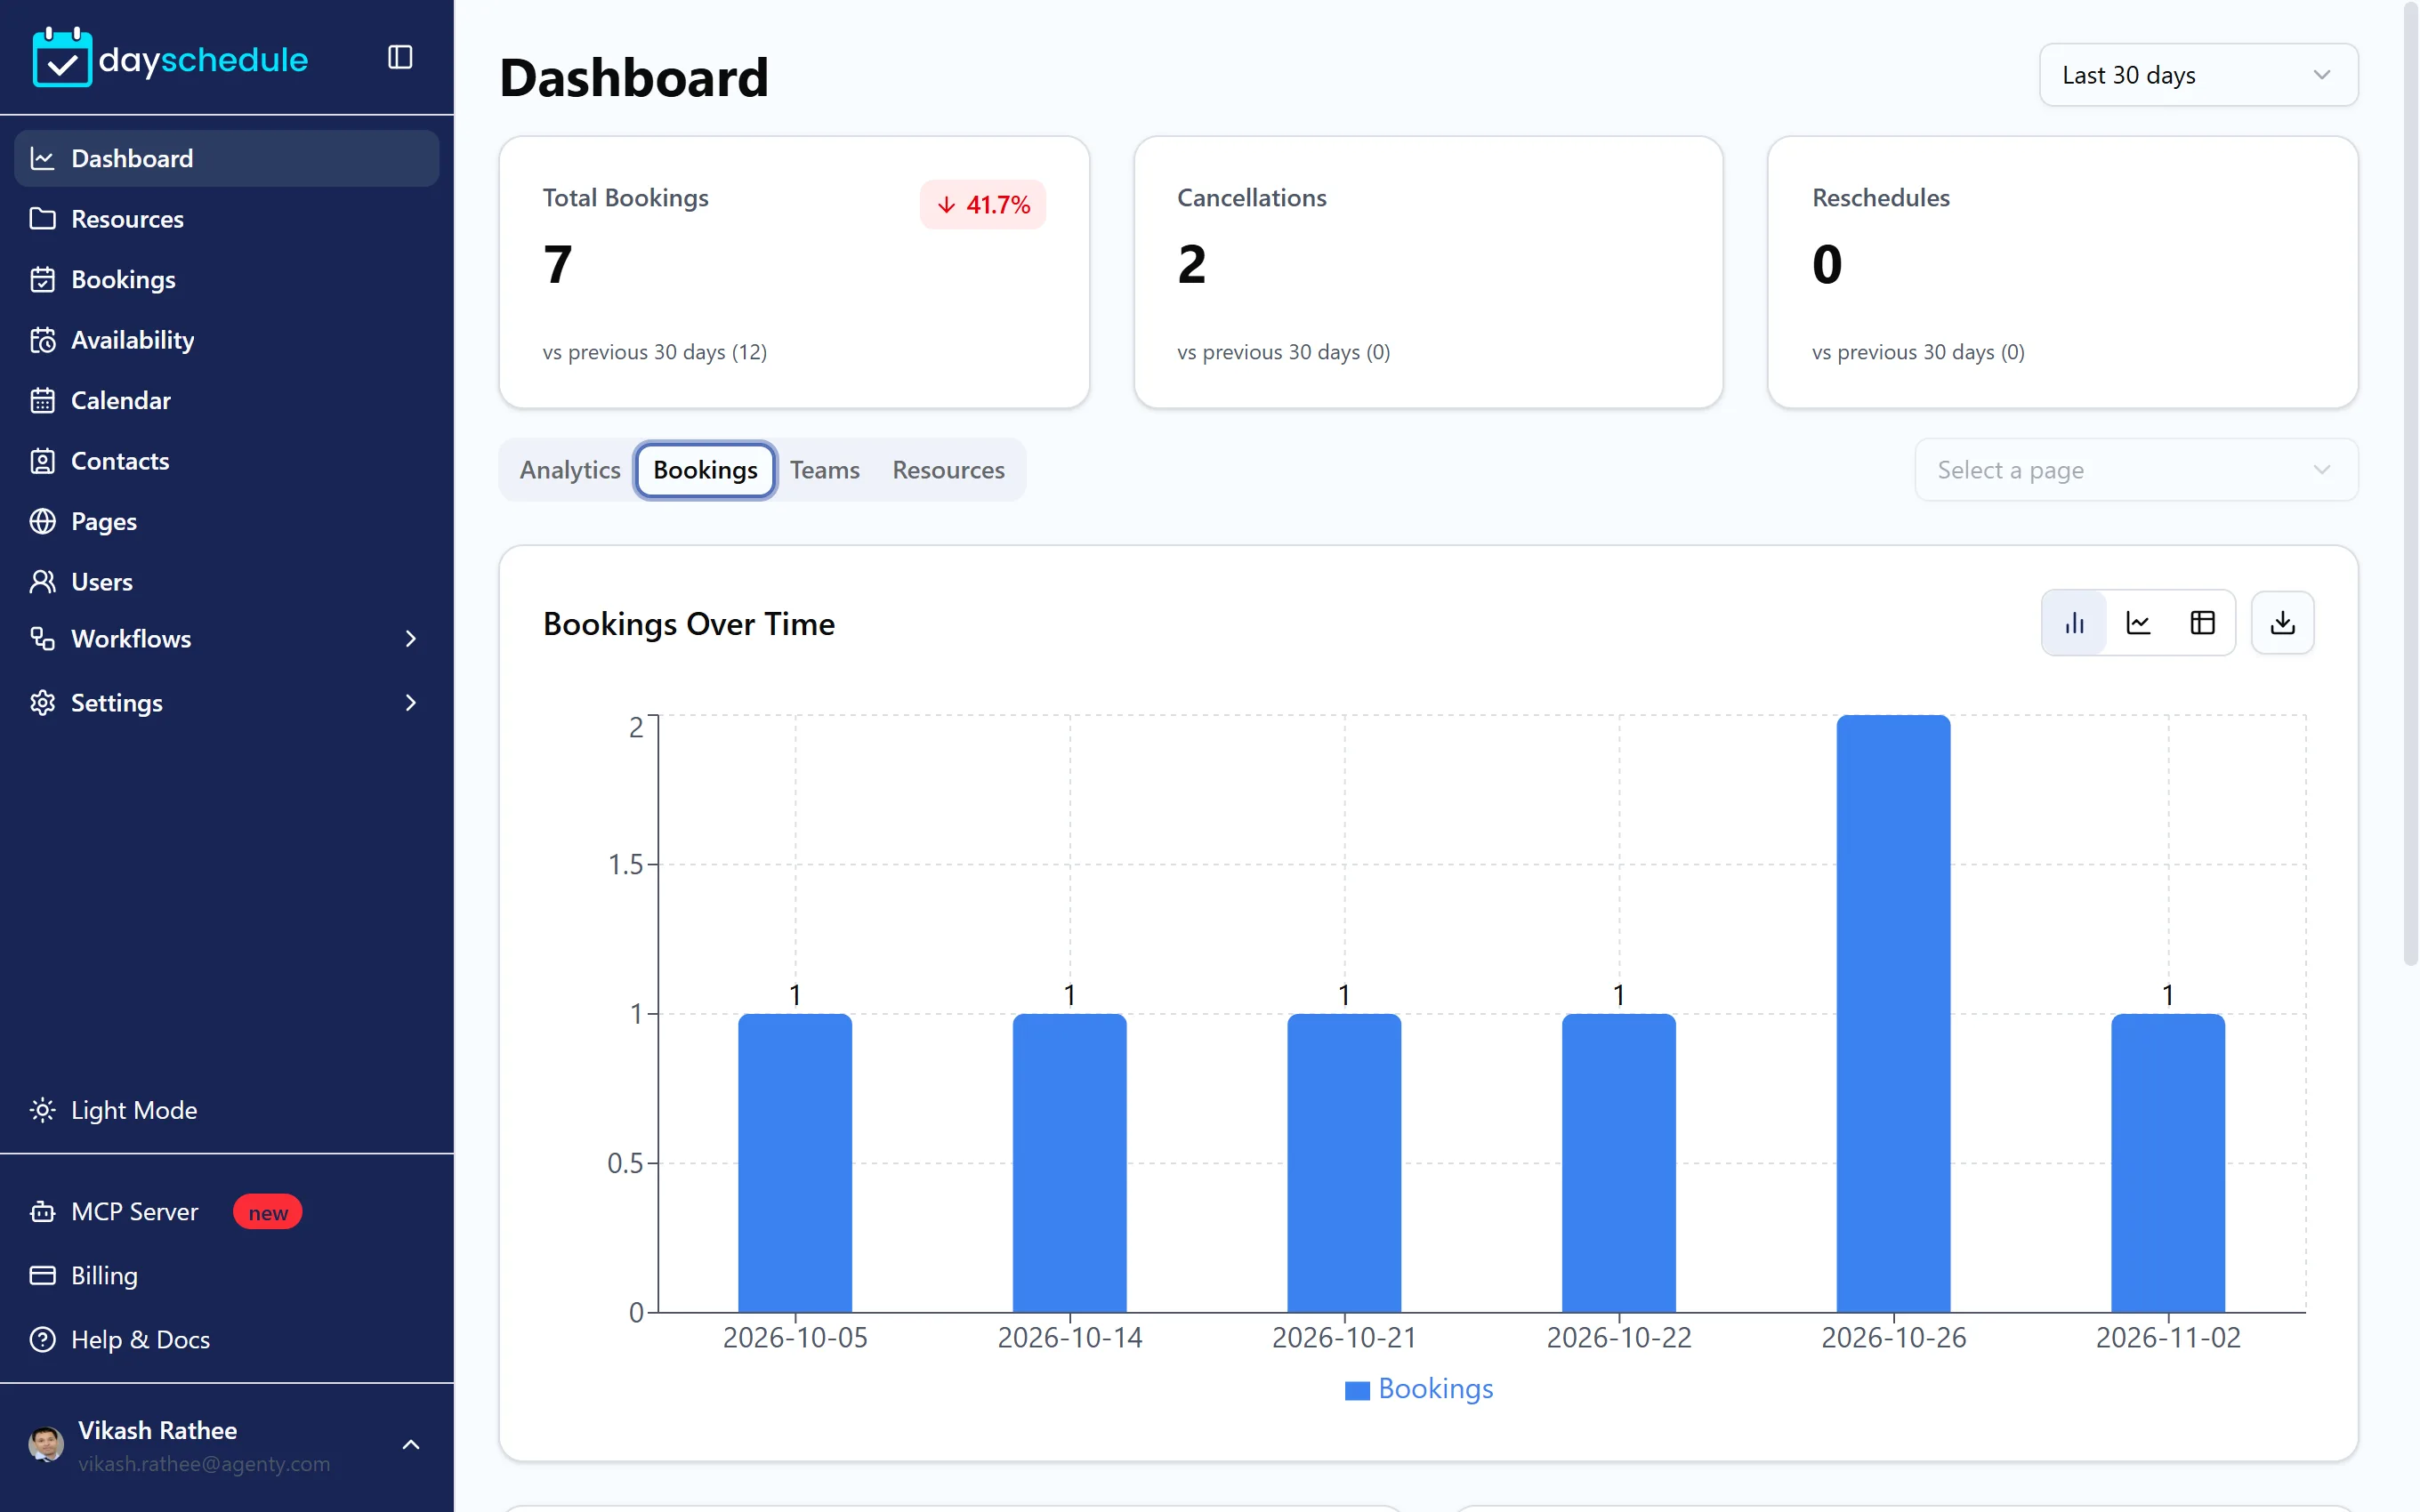
The Bookings tab shows:
- Bookings Over Time, to spot busy days and seasons.
- Customer Distribution, the split between New Customers and Repeat Customers.
- Revenue from paid bookings, per currency. See Accept payments.
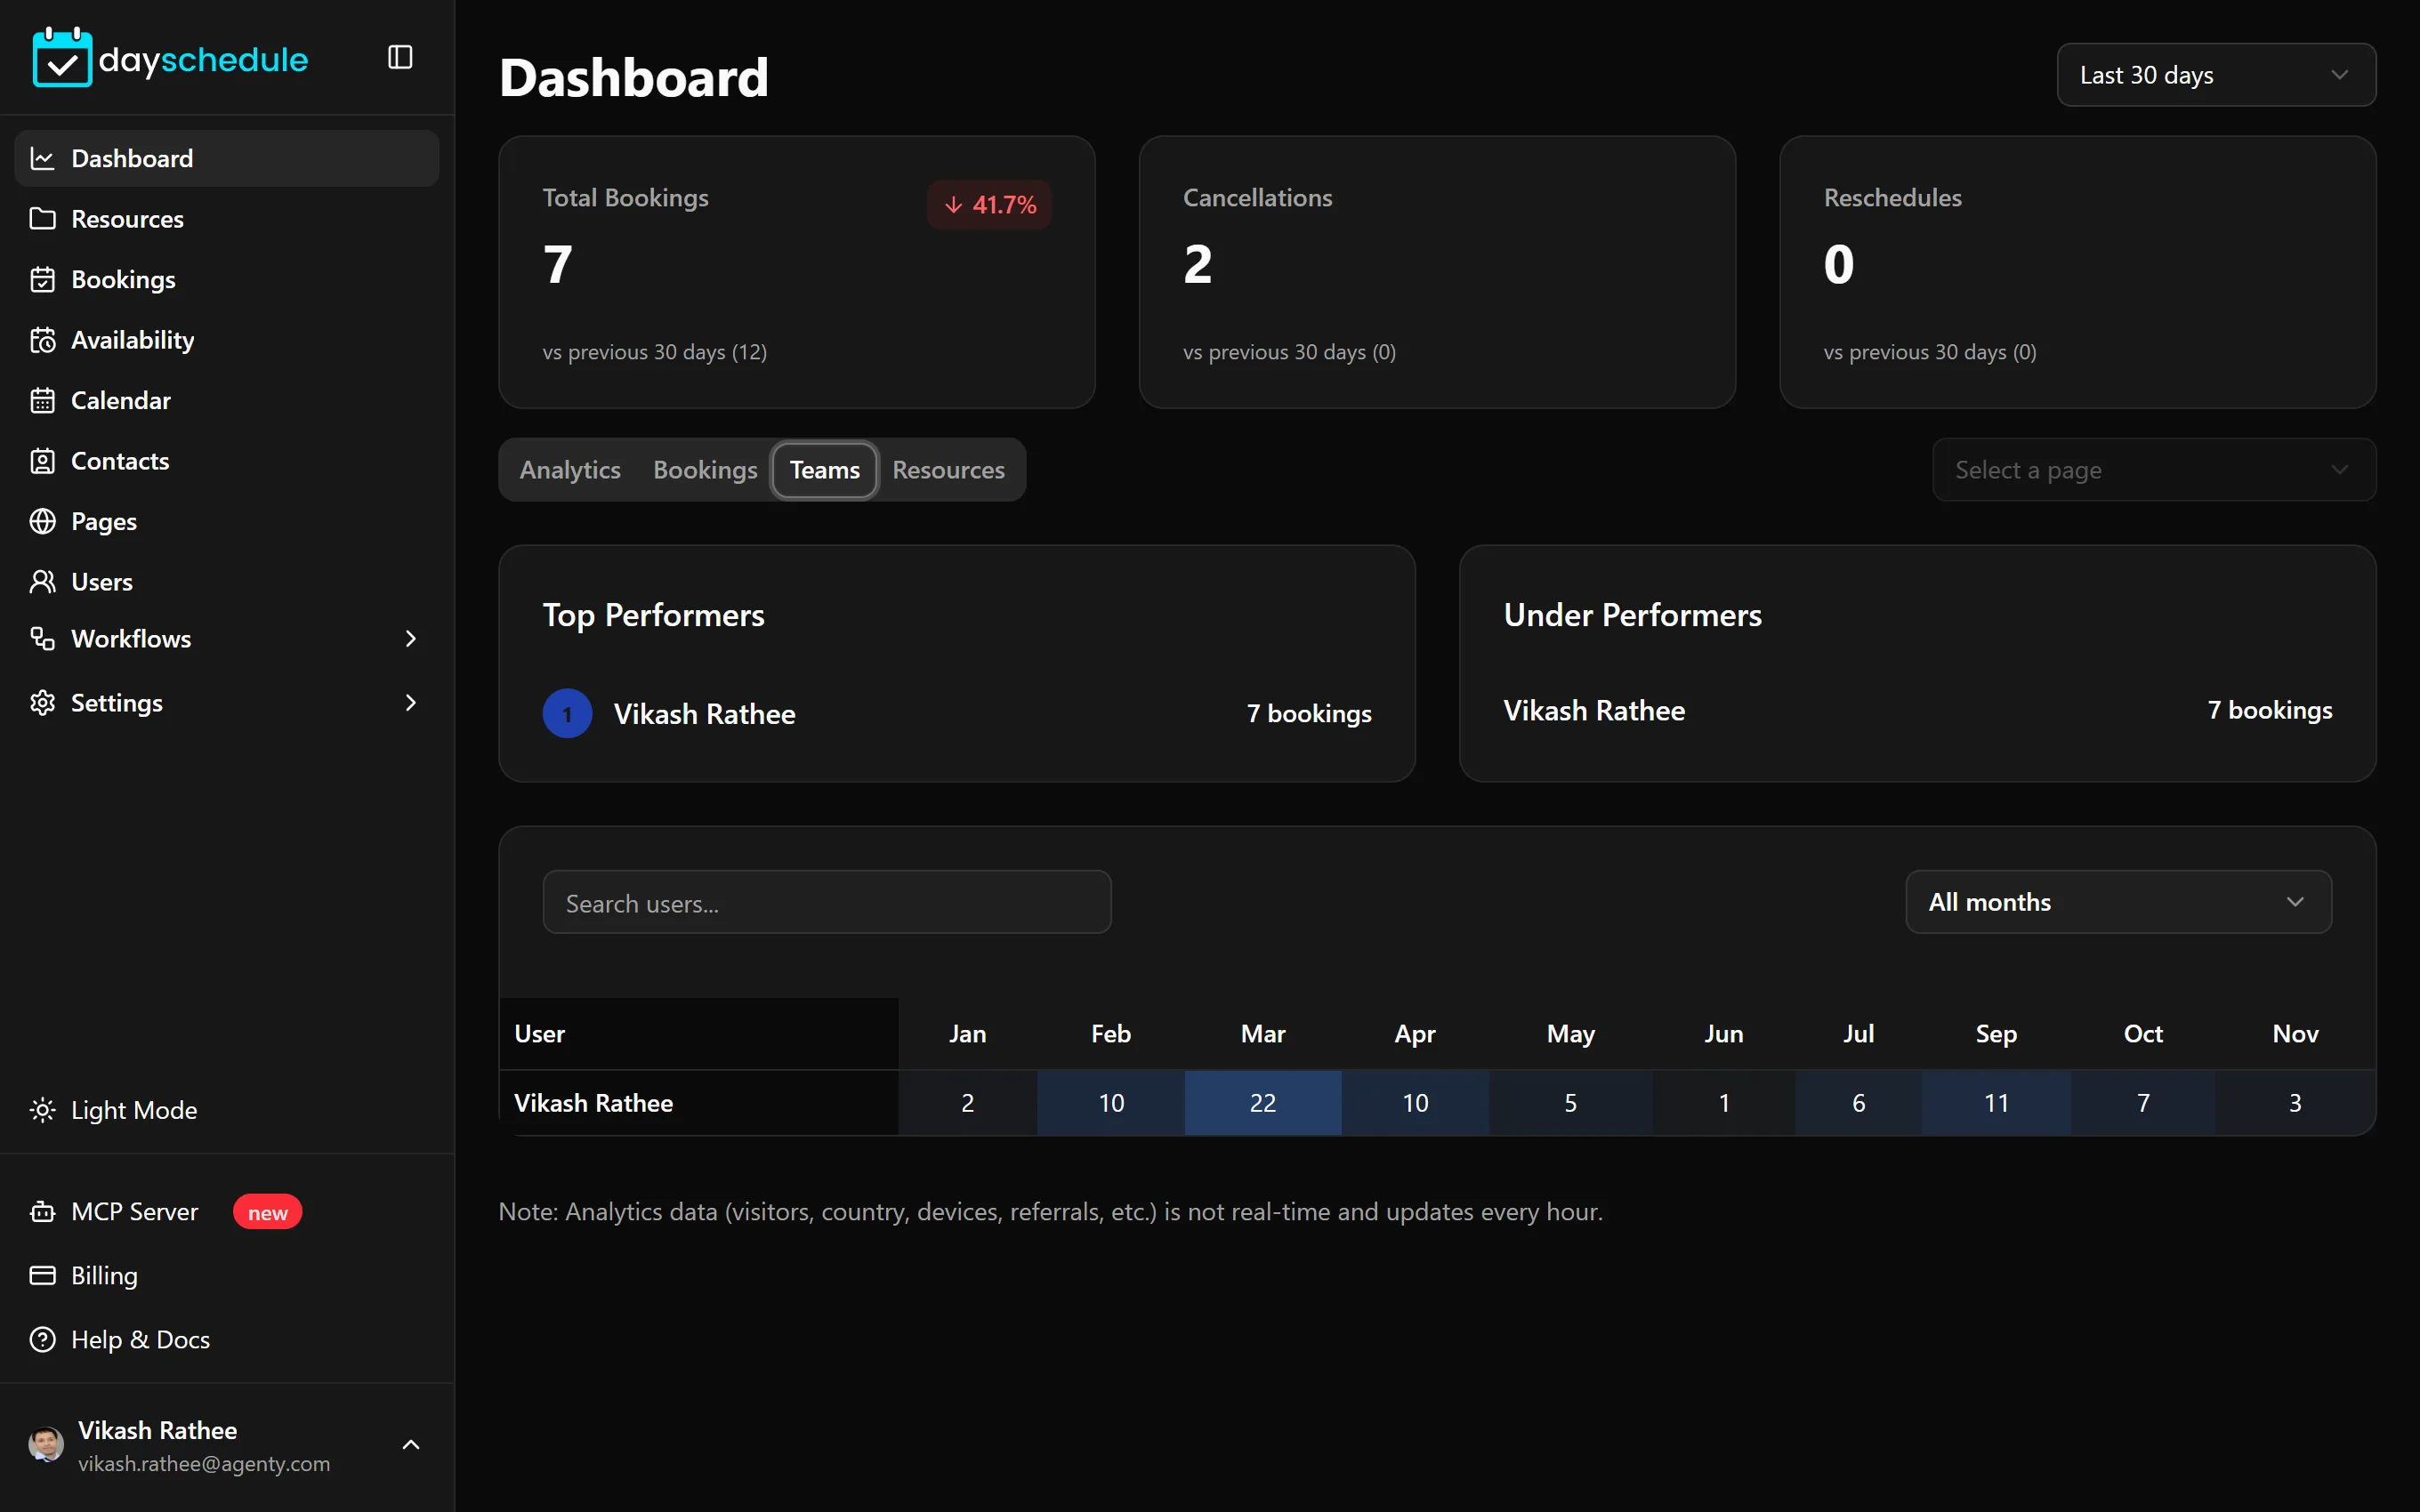
Compare team members
The Teams tab ranks your team by bookings in Top Performers and Under Performers, and shows a table of bookings per member per month. Search for a member, or pick months to compare with Compare months.
The Resources tab shows Resource Usage, the number of bookings per event, so you can see which services are most popular.
For a day-by-day view of free hours and utilization per member, see Team availability. To export individual bookings, use Download on the Bookings page.